This is part of chapter 22 from Louis Gudema’s Bullseye Marketing book, which is available on Amazon.
“Without data, you’re just another person with an opinion.” -W. Edwards Deming
If you’re new to digital marketing, you’ll likely be amazed at the amount of data that the tools collect and the analytics that they provide for you to optimize their performance.
In fact, it can quickly overwhelm you.
Consider just a few of the sources of data:
- website usage data from Google Analytics
- search ad data from Google AdWords and Bing
- email performance data
- landing page conversion data
- social media channel analytics
- ecommerce data
- cross-channel analytics and attribution models
- predictive analytics based on the above, and possibly thousands of third-party data sources.
Now add in data from traditional marketing channels such as direct mail, call centers, print, TV and radio.
To use this tsunami of data and analytics tools effectively you need to focus on what’s important and how to achieve it.
Campaign versus business goals
For most companies the primary business goals will be tied to top line revenue such as increases in qualified leads, opportunities and sales. Those are things that CEOs and CFOs usually care about.
To achieve those, though, as marketers you’ll also have campaign metrics that you’re optimizing, such as conversion rates and website page views. The c-suite likely won’t be very interested in those, and they shouldn’t be.
Consider, for example, the hierarchy of email marketing metrics:
- Increased email opens and shares
- Increased traffic to your website from email
- More qualified leads from that email traffic
- Increased revenue from leads that originated from email
The first two are campaign goals, the last two are business goals.
Increased email opens may indicate you have better Subject lines and content, and you’re building a strong following for your emails, but if that doesn’t produce more traffic to your website then perhaps you don’t have enough, or the right, calls to action in the emails.
If the increased traffic doesn’t produce more qualified leads then you, again, may have an issue with your offers or calls to action, or the website conversion experience.
If you’re getting more qualified leads but that doesn’t produce a good increase in revenue, then you may have an issue with the handoff of leads from marketing to sales, or the sales team may not have the content it needs to close the deals.
Or consider the hierarchy of search engine optimization metrics:
- Higher rankings on search results pages
- Increased organic search traffic to your website
- More qualified leads from search traffic
- Increased revenue from leads that originated in organic search
If your improved rankings aren’t generating more traffic, then either you aren’t optimizing the right pages or you need to create more content that customers are interested in. (This could also suggest a problem with your brand. Consider this situation: a startup company achieves the #2 ranking but is sandwiched between the top two market leaders with 70% market share between them. Few people have heard of the startup so even with a high ranking it’s not getting many clicks.)
If increased organic search traffic isn’t generating many more qualified leads then, again, you may not be ranking for the right content, or your website conversion experience may be deficient.
Each of these is important, but the first two are campaign goals that mainly marketers will care about. The last two are business goals and can be improved similar to how you improved them in your email campaigns.
In the process of using your tools you’ll have countless opportunities to optimize results. The important thing is to stay focused on what really is driving business results.
How to use data
At the top level you may have goals for your company’s growth: you want to grow 5, 10, 20 or whatever percent in the next year. (People who write down their goals tend to be more successful in reaching them.)
With those sales goals in hand you can then work backwards to figure out your marketing goals and plans. Create an upside-down funnel:
- What is your sales team’s close rate? If your sales team closes one in three proposals, then they need three times as many opportunities as final sales. What percentage of opportunities is marketing responsible for generating, and what percentage is sales responsible for?
- Continue that calculation back through your funnel:
- How many of your sales qualified leads become opportunities?
- How many of your marketing qualified leads become sales qualified leads?
- How many new leads are qualified?
- How many new marketing generated contacts become leads?
From this data you should be able to determine how many new contacts and leads marketing needs to generate to hit corporate sales goals. (These may vary by product or offering, too. Or deal size.)
You can make a similar calculation for ecommerce sites, and for B2C and retail companies.
Once you have these target funnel numbers you can work on the programs that will generate those new contacts and leads, move them through the pipeline, and help sales close them. Use data and analytics to constantly be improving channels and campaigns.
You may start with a hypothesis: Email generated X new qualified leads last year. We need X plus 25% from email this year. We can achieve that by (1) increasing our list size, (2) changing the frequency of the emails, (3) having more effective offers and calls to action, (4) improving the landing page and conversion experience, or (5) some combination of those and other factors (subject lines, email copy, etc.). Then you can test each of these to reach your results.
Sometimes you will find that a particular channel or campaign simply isn’t going to produce the results that you need. That is valuable information, too; everything is an experiment. Thomas Edison’s team tested 10,000 materials before finding the one that would work for the light bulb filament. He said, “I have not failed. I have just found 10,000 ways that won’t work.”
Persist. Keep experimenting. Keep track of everything. And if you have a valuable product or service, you will find the best channels for generating new business for it.
Marketing attribution
In this omni-channel world where you need to connect with your customers throughout their buying experience, attribution models help you determine the relative importance of the various marketing channels toward the final sale.
There are many marketing attribution models. Let’s look at the pros and cons of three.
Last click/interaction
Let’s say that a person clicks on one of your search ads, comes to your website, and buys something. With the last click model, you give 100% credit for the sale to the search ads.
However, this is probably not very accurate. The person may have had several interactions with your brand before actually buying. They may have visited the website a few times, read reviews of your products on review sites, watched a few videos on YouTube, and so on. They may have been interested in your product for years. But with the last click model, none of that counts.
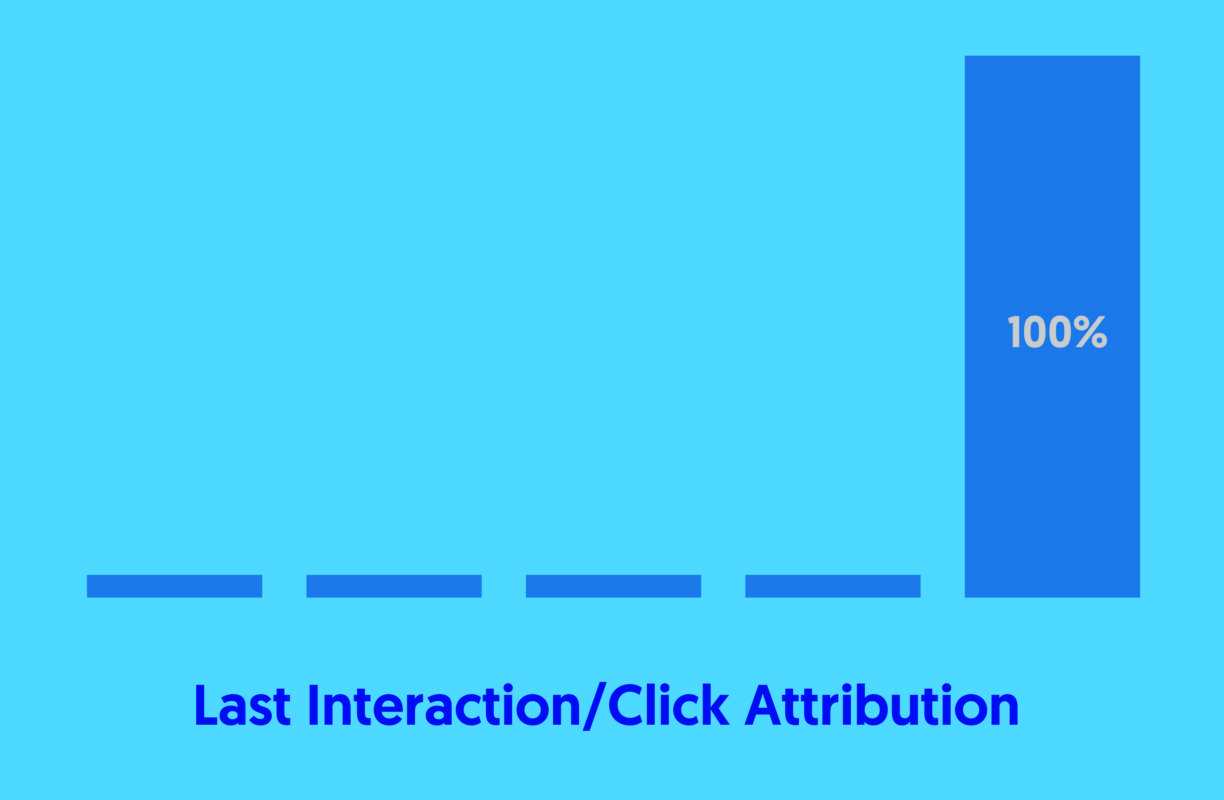
Despite these problems, the last click model is the most commonly used for one simple reason: it’s the easiest. Companies may have the data for a last click attribution; it’s much more difficult to track an individual through all of their interactions with your brand on multiple devices that lead up to an ultimate sale.
First click/interaction
The first click model gives credit to marketing for its contribution of qualified leads to the pipeline. This may be an especially useful model in a B2B companies with a long sales cycle and many members on the buying team — in which the sales team will be ultimately responsible for closing the deal.
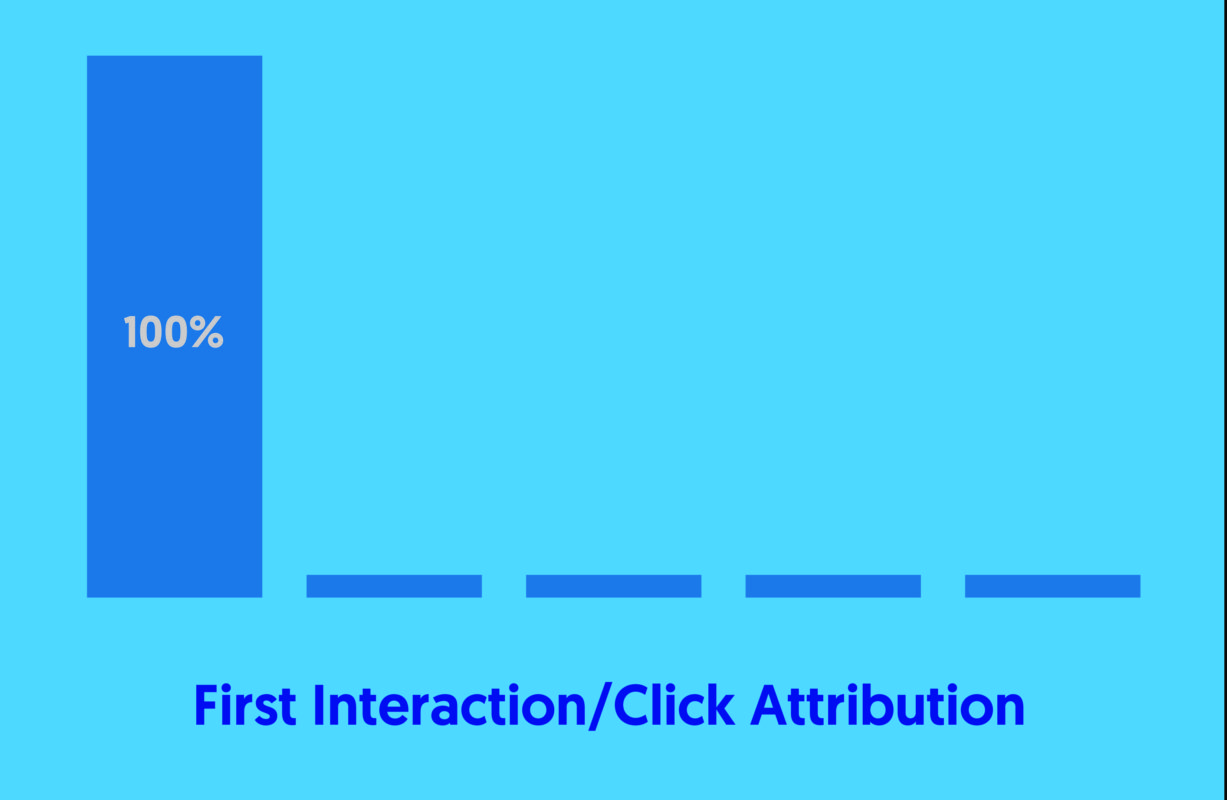
First click may also be the only option for a company that sells through distributors or dealers and doesn’t have insight into which leads are eventually closed and turn into revenue.
Multi-channel attribution
Multi-channel attribution models are the ideal. Time decay is one version of a multi-channel attribution model. It gives a larger weight to the most recent actions but doesn’t entirely disregard earlier actions like the last click model does.
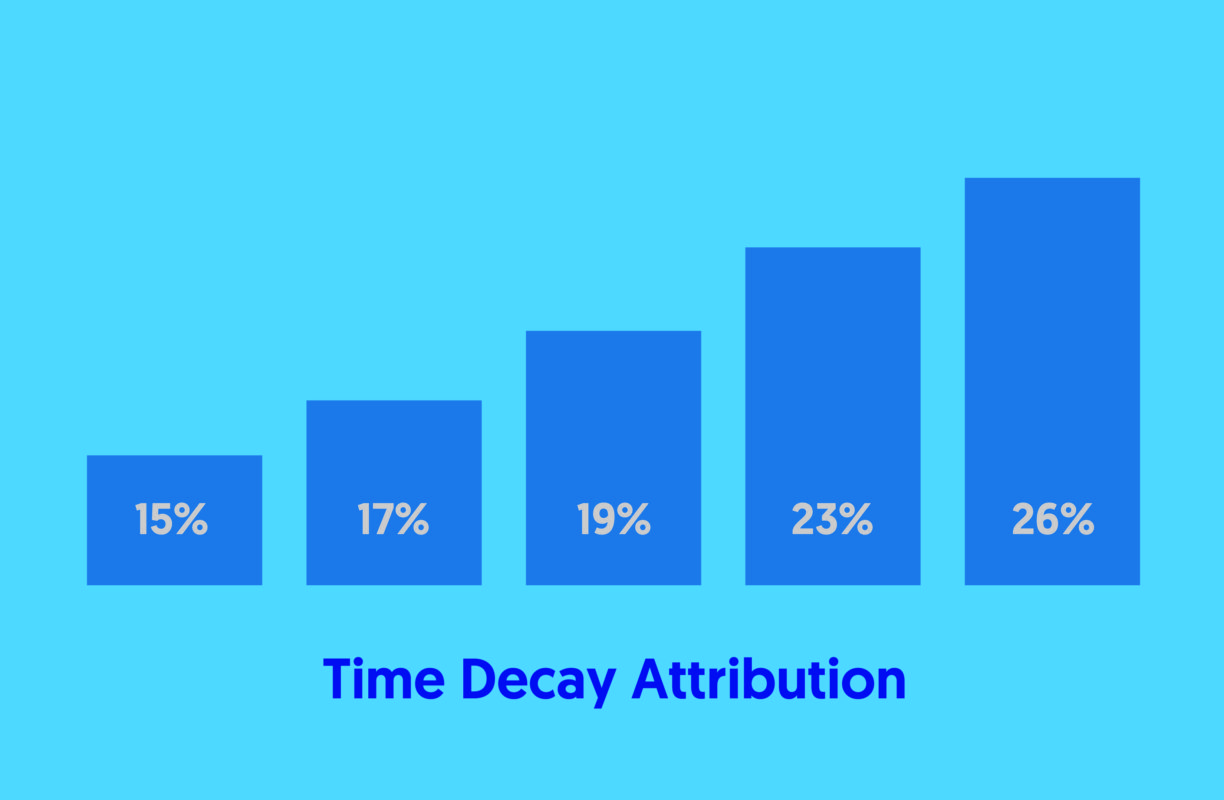
Multi-channel models present many challenges. The first is the question of identity: how to track individuals across many devices and interactions. You also need a large amount of data to be able to analyze it effectively and tease out actionable insights.
You may want to start with a simpler model and over time move toward a multi-channel model.
Geo-targeted testing
Geo-targeted testing is a different way to measure the effectiveness of particular channels and campaigns. A company operating nationally may test TV or print ads in just two or three cities and measure the increase in brand awareness and sales in those cities to decide if it’s worth it to take the campaign national.
You can use geo-targeted testing with other channels such as emails, retargeting, search and display ads. If your following is large enough, you can even geo-target Facebook posts.
What’s a lead or sale worth?
A key metric for marketers is the customer acquisition cost (CAC).
The CAC is easy to calculate. Simply take all of the sales and marketing costs and divide them by new customers. So on the most basic level if you spent $10,000 on sales and marketing and gained 10 new customers, your CAC would be $1000.
It gets more complex when you start to calculate CAC by channel – remember the issue with the attribution models — and the value of those new customers.
CAC for direct sales, distributors, dealers and online channels may all vary.
And your margins will likely be different by channel, too. For example, a retailer may find that selling online is less expensive than selling in a traditional store. (Or the opposite may be true: in the store, there are little or no picking, packing, and shipping costs. And the building may have been paid for 20 years ago.) Software companies have certainly found that selling SaaS software that’s they deliver online is far less expensive than selling boxes at retail.
Finally, you need to consider if you need to make a profit on every purchase or if you will be basing your strategy on the lifetime value of the customer.
The lifetime value (LTV) is the average profits (not revenues: profits) that you make on a customer during your entire relationship. If a customer typically makes just one or few purchases, like a person buying a house, their LTV may be almost all in that first sale.
I worked with a company that sold high-end computer memory systems. Deals could be worth millions of dollars. They accepted a CAC of tens of thousands of dollars given the profits made on the systems, and the lifetime value of the typical customer over many years. Reportedly the company that won the $2.68 billion contract to operate Boston’s commuter rail system spent over $4 million to win the deal.[i]
Similarly, attorneys bid up the cost per click for search ads for mesothelioma (cancer typically caused by exposure to asbestos) because these cases typically settled for hundreds of thousands of dollars, which the attorney would get 25-33 percent of. It was worth thousands of dollars to get a new client with fees like that at stake.
However, if the economic value of a customer is primarily through a long string of follow-on sales, then you’ll need to calculate the LTV over many years — or even a lifetime. The classic example is companies selling razors, as described in chapter 11.
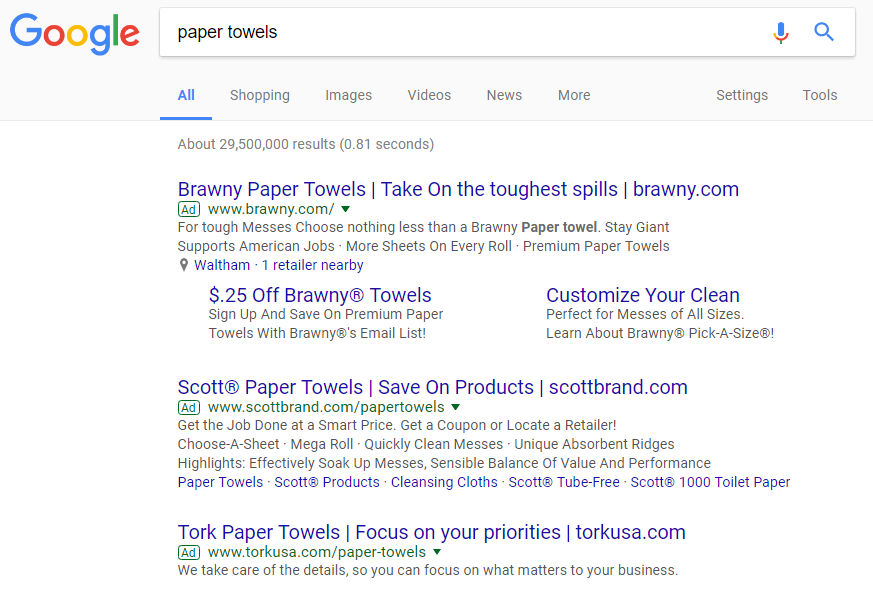
The same focus on customer lifetime value is why companies like Brawny and Scott pay several dollars per AdWords click to promote their paper towels. They’re getting their product in front of people who are likely to be buying soon. And, if they buy once, the companies may able to convert them into long-term customers.
SaaS companies typically calculate that they need a LTV of at least three times CAC to operate profitably. That LTV:CAC ratio will be different for every industry depending on some of the factors that I mentioned above.
Work with the executive team to work this out and establish acceptable CAC metrics for your company.