While Yelp has 1-5 star ratings, in practice its ratings are:

5 – Amazing; get there tonight

4.5 – Outstanding, not to be missed

4 – Good. Recommended

3.5 – Avoid this.

3 and below – Out of business

Each Yelp star produces considerably more business. And why would you go to a 3 or even 3.5 when there are so many 4-5 rated restaurants around.

Unless the restaurant is owned by Food Network star Guy Fieri.

Low Yelp reviews

Fieri is immensely popular and his restaurants do well even with terrible ratings on Yelp and from critics.

There’s an old saying in marketing, “Nothing kills a poor product faster than great marketing.” For five years the Food Network jetpack has helped Fieri defy gravity. The curiosity factor has outrun the reviews. Maybe someday they will catch up.

When giving talks on digital marketing I often include a slide that shows what Google AdWords costs per clicks (CPC) can get bid up to in competitive industries. I recently updated the slide and found that for many keywords CPCs have declined by 50% or more since last year.

AdWords CPC comparison 2016 and 2017

So I did some research and found that people first started to comment on this in August. Many AdSense users – people who own sites where Google ads appear – were complaining that suddenly they were being paid far less.

But for advertisers and marketers this is a windfall. This may make search advertising affordable and cost effective in industries where it wasn’t in the past.

Bing has far lower CPCs than AdWords. And you can see from the chart that its older, less tech savvy users are really not searching for tech solutions.

If LinkedIn is important to you for professional networking, social selling, or other purposes, then you want people to be able to find you when they are searching. LinkedIn is a search engine, so you should optimize your profile for search.

You can see the search terms that people are using to find you if you go to your profile, click on “search appearances” in your dashboard, then scroll down to What Your Searchers Do

LinkedIn profile searchers

…and Keywords Your Searchers Used

LinkedIn search terms

Having Business Owners as the #1 group that is finding me on LinkedIn is good: those are often my clients. But the keywords that I’m showing up for are not really on-target. The second is possibly good (but kind of odd), and who knows what someone looking for SMB or “digital” is interested in?

In response to looking at this I went through my profile and added “marketer”, “business strategist” and other terms appropriately.

I was recently reviewing the Google Analytics website data from a company. They have 11,400 pages on their site, but 59% of traffic is going to just the 100 most viewed, and another 10% is going to pages 101-200. So fewer than two percent of their pages account for 69% of their traffic.

This is a dated website – it’s not even responsive (doesn’t display properly on smartphones) – and it needs a major overhaul. But with that many pages it’s going to take months just to figure out what to keep, update, and delete. And it’ll take considerable money to create the strategy and design for a new website, create entirely new content, and select, license and implement a new content management system, etc.

Meanwhile, by making the site responsive, which could be done relatively inexpensively in just a few weeks, and focusing on improving those most important 100-200 pages, they can see measurable results quickly.

Perfect is the enemy of good. Don’t overlook a substantial, quick improvement while waiting on it.

PS: Donors to schools and colleges are also skewed much more than the traditional 80:20 Pareto rule suggests. In many cases just 5 percent of donors give 95 percent of the money with a few, big gifts. What’s the Pareto distribution for revenue among customers at your company? Or for other key metrics?

The MarTech Conference is in Boston starting Monday evening. (If you want a free Expo pass, you can get it here — courtesy of Sales & Marketing Innovators — and please come to the expert panel at 7pm Tuesday on How Sales and Marketing Strategies Work Together to Drive Revenue. This also is free – you need the Expo pass to get in – and run by SAMI.)

Continue reading

Note: in February, 2019, about 17 months after it was published, I heard from the CEO and COO of HubSpot that my analysis of their rising CAC after 2014 was incorrect. This is my update to this piece

This is the original piece:

In just a few years the customer acquisition cost (CAC) for HubSpot has more than doubled.

Could your company afford to spend more than twice as much to acquire each new customer?

In this post I review this and what it means for the efficacy of inbound marketing.

The HubSpot Customer Acquisition Cost

The Customer Acquisition Cost (CAC) is the average cost for each new customer. It is one of the most important metrics for a company and a marketing organization.  You need to keep your CAC below the lifetime profits from a customer — their lifetime value (LTV) — or you’re losing money on each customer. And you won’t make it up on volume.

Companies usually aim for a customer LTV that’s at least three times the CAC.

HubSpot wrote in its annual report for 2014, “We believe that customer acquisition cost, or CAC, is an indicator of the efficiency of our sales and marketing programs in acquiring new customers.”

And in just six years the HubSpot CAC increased over 130 percent.

Basically, the CAC is easy to calculate: it’s a company’s total marketing and sales costs divided by the number of new customers acquired in that period. So if a company spent $10,000 on sales and marketing and acquired 10 new customers, its CAC would be $1,000.

When HubSpot went public in 2014, and in its first annual report after going public, it reported this information:

Right off the bat we can see that in just four years, with little notice, the HubSpot CAC almost doubled – it was up 79.8%.

WTF? The goal is to lower the CAC as you learn more about your customers, target more effectively, build up SEO domain authority and organic search traffic (as HubSpot has).

What has happened since 2014?

Well, in 2015 and 2016 HubSpot stopped reporting their CAC in their annual reports at all. I reached out to their investor relations group and requested the 2015 and 2016 CACs and they refused to provide them.

So I calculated it. (To keep our focus for now on the bigger issues, I put at the end of this post more detail on how I calculated the HubSpot CAC for those two years.)

Here are the numbers that HubSpot published and my calculated CACs for 2015 and 2016:

No doubt my calculated CACs are not accurate to the dollar. But I’m confident that they’re close enough for this discussion.

And they show a 133% increase in the HubSpot CAC in just six years. The trend line is pretty steady.

Why is HubSpot so shy about publishing their CAC now? They report a lot of other company metrics such as those on slide 34 of this annual report. But they won’t give out their CAC anymore. Given how open they have been about so much data throughout their history that suggests that it’s not good. As my calculations show.

HubSpot CAC 2011-2016

What does this mean for inbound marketing?

Why should you care about the CAC of this one company?

HubSpot is a very important company to marketers because not only does it provide a marketing automation program (MAP) and CRM used by over 20,000 mostly small- and mid-sized companies (SMBs), but it created and evangelized the inbound marketing approach. It is so identified with inbound that it calls its annual customer conference, which will be held next week, Inbound. They describe inbound as a movement, “the inbound movement”.

As a result of the successful evangelizing by HubSpot Inbound marketing is one of the most popular marketing approaches today. (For those unfamiliar with it, HubSpot describes inbound as “an approach focused on attracting customers through content and interactions that are relevant and helpful — not interruptive. With inbound marketing, potential customers find you through channels like blogs, search engines, and social media.”)

HubSpot also claims, “Since 2006, inbound marketing has been the most effective marketing method for doing business online.”

Maybe it’s been effective, but the numbers from their own business argues that increasingly it isn’t cost-effective.

If the CAC for the company most expert in inbound marketing keeps going up so rapidly, then that suggests that the inbound channel can be exhausted. They’ve picked the low hanging fruit, or too many competitors are now replicating the tactic, and it’s going to keep getting more and more expensive for them to acquire future customers.

It is not uncommon for a marketing channel to become exhausted, or at least a lot more expensive. Marketers can spot it by seeing a declining efficiency in their programs and an increasing cost per lead. For example, the cost for search ads in some highly competitive industries has been bid up to several hundred dollars per click.  Your social media messages can get crowded out by those of competitors; the typical post by a brand now is only seen by 2-3 percent of its followers. More content makes it harder to get high organic search rankings; SEO software firm Ahrefs found that only about 5% of new content even gets a page 1 ranking in the first year, let alone a ranking in the top 3 or 4 positions that can actually drive significant traffic. And – as Mark Schaefer predicted in his Content Shock blog post — competition will make content marketing unsustainably expensive for some companies.

HubSpot has written about the amount of content it takes to really move the needle; it’s a level that few SMBs achieve. While saying things like, “If you have more money than brains you should focus on outbound; if you have more brains than money you should focus on inbound”, HubSpot itself has spent millions of dollars creating and amplifying content to feed the beast.

This is why I put inbound marketing in the third, outer ring of my Bullseye Marketing Framework, which is designed for use by SMBs (who are HubSpot’s main customers, too). In a competitive industry it can take a couple years, or longer, and a lot of money to move the needle with inbound. The center of the Bullseye activities, which involve taking better advantage of existing company marketing assets, are far more effective for the first year or so, followed by search marketing and other programs informed by intent data.

Bullseye with three rings

All of the money and effort that HubSpot has put into content development and inbound marketing has not been wasted. SEMrush and SpyFu both report that HubSpot is getting about $5 million of organic search clicks each month — $60 million a year. That’s an evergreen asset that will keep delivering search traffic to HubSpot for a long time.

But that traffic is not an efficient lead generation source. For HubSpot itself, according to its 2013 data when it was generating 60,000 leads a month, it took over 150 new inbound leads to produce one new customer. That’s actually better than for some companies using inbound.

When Jim Williams was Vice President of Marketing at Influitive he reported that only .25% of their new contacts became customers – just one in 400. He said, “These stats are actually quite common for high volume inbound funnels.”

Indeed they are. When I mentioned them to an analyst at a leading sales and marketing advisory firm he responded, “If not worse.”

To properly qualify and respond that kind of lead-to-deal ratio takes a lot of BDRs, software and money.

In a few cases, inbound can be much more efficient. If you have the rare situation of being in a nascent industry where (1) many people are searching for content with narrow search terms, and (2) you don’t have many competitors creating content, you can get high rankings and significant numbers of qualified inbound leads quickly. But that situation is rare.

Can HubSpot afford inbound? Can you?

So now let’s consider the original question in the title of this post: Can HubSpot afford to do inbound marketing anymore? And more importantly, can you?

HubSpot has access to the capital markets. It raised $100 million from VCs in six rounds over seven years to fuel its product development, marketing and sales. Then in 2014 it raised another $125 million with its IPO. It can afford to lose money as it builds its business. And it has. In over a decade it has never had a profitable quarter.

The more important question is: Can your company afford inbound marketing?

If you’re one of the 99% of startups who don’t receive venture funding, or have founders with very deep pockets, than you need to grow organically and — pretty quickly – profitably. Inbound isn’t usually going to produce results quickly and inexpensively enough.

The same is true for more mature SMBs, which is why I usually prescribe starting in the center of my Bullseye Marketing Framework instead.

Inbound really is for established companies that are generating profits and can wait a year or two or three for a significant impact.

And it depends on your competitive situation. If you’re in a market with lots of competitors who are pouring out tons of content, then the answer is: Probably not.

If you’re in an unusual industry like I described before, with many people searching for your offering and not much content competition, then inbound may be a good, long-term strategy for you.

What’s your competitive landscape look like? How much can your company afford to invest? How long can you wait for results?

What is your customer lifetime value relative to your customer acquisition cost? Is it profitable and sustainable?

No marketing strategy should be called a “movement”. Movements are for universal values. The Civil Right Movement was for equal rights for all people. The Women’s Movement was for all women having legal, economic and social parity with men.

But marketers should be guided by their particular situation, and the data, not by ideology. When inbound works, use it. When social media marketing works, use it. When account based marketing works, use it. When my Bullseye Marketing Framework works, use it.

And when they don’t, don’t. And switch to the strategies that will.

Update: A week after posting this, I received this tweet from a former VP of Sales at HubSpot:

This confirms my earlier point that if a company’s LTV is high enough — typically more than 3X its CAC for a SaaS company — then it can afford a high CAC. Few companies will be able to grow their LTV fast enough to support such a rapidly rising CAC, though.

Also note that HubSpot is using a strategy that is at the heart of my Bullseye Marketing Framework — upselling current customers — to drive that LTV increase. Selling more to current customers will always be faster and cheaper than acquiring new accounts.


Footnote: About calculating the HubSpot CAC for 2015 and 2016

Here’s how I went about calculating HubSpot’s CAC for those two years.

If you look at the numbers for 2011-2014 and divide the marketing and sales spend by the increase in total customers each year, you don’t get their CAC. That’s because there’s a third factor: the churn rate.

Remember: to calculate the CAC you’re dividing by the total number of new customers. Every company loses some customers during the year, and the rate of that is called the churn rate. So in addition to the difference between total customers from year to year you need to add in the replacement customers to calculate the total number of new customers.

And – this part is important for the calculations in the next few paragraphs — with a certain marketing and sales spend, the higher the churn rate, the lower the CAC will be because a high churn rates requires a higher number of replacement customers. That’s just how the math works.

Think of it this way:

Let’s say a company in year 1 has 1,000 customers and in year 2 has 1,200 customers. If it lost no customers in year 1 – a churn rate of 0% — then the number of new customers would be 200. But if it lost 25% of its customers during year 1 — 250 customers — the number of new customers that marketing and sales produced is 450. That will have a big impact when calculating that company’s CAC.

If you have these three numbers for multiple years you can calculate the churn rate:

  • Total customers
  • Marketing and Sales expense
  • Customer Acquisition Cost

Given the numbers that HubSpot provided in its reports I calculated these approximate churn rates:

Is this accurate? More to the point: Is it likely that HubSpot was able to significantly improve their churn rate in just a couple years? Reducing churn was a key focus at HubSpot at that time. In 2015 their then Chief Revenue Officer described how they had gone about reducing their churn rate. But they never publicly said what their churn rate was before or after; I calculated it.

I could be wrong about these. These are very high churn rates; average SaaS churn rates are below 10 percent. But average is kind of meaningless since SaaS offerings range from a few dollars a month for Hootsuite or MailChimp to thousands a month for enterprise software. Even at HubSpot prices range from $200/mo at the low end to $2,400/mo and up at the enterprise level. Their churn rates probably vary considerably by segment.

For 2015 and 2016 we only have two of the three numbers we need to calculate the CAC, so I based my calculations on the assumption that they continued with that 2014 churn rate of 23% for the next two years.  The calculated CACs for 2015 and 2016 are approximations, but I believe that they’re close enough to support the general points that I am making, especially given the known CACs for the previous four years.

But what if their churn rate is actually 20%? Or 15%? Or below 10%? Then their calculated CAC for 2015 and 2016 would be even higher. (The given sales and marketing spend would be divided by fewer new customers.) So, if anything, those are conservative.

It is worth mentioning that not all demand generation and leads at HubSpot are inbound. They have quietly mixed in outbound programs like Google AdWords and telesales all along.

But they have always touted inbound as the single most important strategy for them — and that it should be for their customers, too.

This is the first chapter of Bullseye Marketing, by Louis Gudema. You can buy the book on Amazon

In this book I’ll introduce you to Bullseye Marketing which prioritizes the fastest, least expensive tactics for generating new leads and sales. And I’ll also be sharing hundreds of actionable insights and tips that you can start using right away.

With the Bullseye you work from the middle out because in the middle are the fastest and least expensive ways to produce new leads, opportunities and sales.

Continue reading

Eight out of 10 small businesses fail in the first 18 months. I ran my own small business for a dozen years, taking it national and then selling it. I have also acted as vice president in three other businesses with 10-100 employees, coached CEOs, mentored startups at MIT, and have many small businesses as clients. As a result of this experience, and talking with countless other small business executives, I believe that these are the five main reasons why so many small businesses fail:

Continue reading

This is part of chapter 22 from Louis Gudema’s Bullseye Marketing book, which is available on Amazon


“Without data, you’re just another person with an opinion.” -W. Edwards Deming

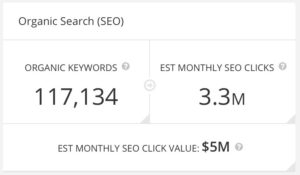
If you’re new to digital marketing, you’ll likely be amazed at the amount of data that the tools collect and the analytics that they provide for you to optimize their performance.

In fact, it can quickly overwhelm you.

Consider just a few of the sources of data:

  • website usage data from Google Analytics
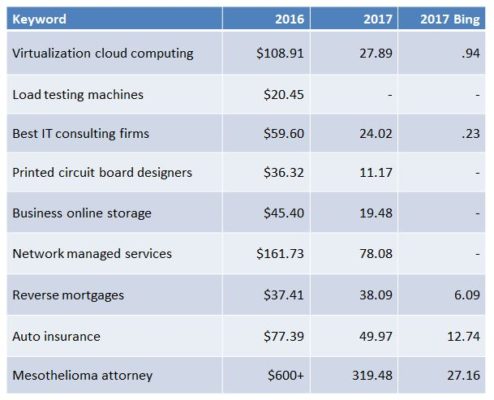
  • search ad data from Google AdWords and Bing
  • email performance data
  • landing page conversion data
  • social media channel analytics
  • ecommerce data
  • cross-channel analytics and attribution models
  • predictive analytics based on the above, and possibly thousands of third-party data sources.

Now add in data from traditional marketing channels such as direct mail, call centers, print, TV and radio.

To use this tsunami of data and analytics tools effectively you need to focus on what’s important and how to achieve it.


Campaign versus business goals

For most companies the primary business goals will be tied to top line revenue such as increases in qualified leads, opportunities and sales. Those are things that CEOs and CFOs usually care about.

To achieve those, though, as marketers you’ll also have campaign metrics that you’re optimizing, such as conversion rates and website page views. The c-suite likely won’t be very interested in those, and they shouldn’t be.

Consider, for example, the hierarchy of email marketing metrics:

  1. Increased email opens and shares
  2. Increased traffic to your website from email
  3. More qualified leads from that email traffic
  4. Increased revenue from leads that originated from email

The first two are campaign goals, the last two are business goals.

Increased email opens may indicate you have better Subject lines and content, and you’re building a strong following for your emails, but if that doesn’t produce more traffic to your website then perhaps you don’t have enough, or the right, calls to action in the emails.

If the increased traffic doesn’t produce more qualified leads then you, again, may have an issue with your offers or calls to action, or the website conversion experience.

If you’re getting more qualified leads but that doesn’t produce a good increase in revenue, then you may have an issue with the handoff of leads from marketing to sales, or the sales team may not have the content it needs to close the deals.

Or consider the hierarchy of search engine optimization metrics:

  1. Higher rankings on search results pages
  2. Increased organic search traffic to your website
  3. More qualified leads from search traffic
  4. Increased revenue from leads that originated in organic search

If your improved rankings aren’t generating more traffic, then either you aren’t optimizing the right pages or you need to create more content that customers are interested in. (This could also suggest a problem with your brand. Consider this situation: a startup company achieves the #2 ranking but is sandwiched between the top two market leaders with 70% market share between them. Few people have heard of the startup so even with a high ranking it’s not getting many clicks.)

If increased organic search traffic isn’t generating many more qualified leads then, again, you may not be ranking for the right content, or your website conversion experience may be deficient.

Each of these is important, but the first two are campaign goals that mainly marketers will care about. The last two are business goals and can be improved similar to how you improved them in your email campaigns.

In the process of using your tools you’ll have countless opportunities to optimize results. The important thing is to stay focused on what really is driving business results.


How to use data

At the top level you may have goals for your company’s growth: you want to grow 5, 10, 20 or whatever percent in the next year. (People who write down their goals tend to be more successful in reaching them.)

With those sales goals in hand you can then work backwards to figure out your marketing goals and plans. Create an upside-down funnel:

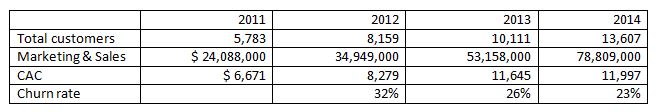
  • What is your sales team’s close rate? If your sales team closes one in three proposals, then they need three times as many opportunities as final sales. What percentage of opportunities is marketing responsible for generating, and what percentage is sales responsible for?
  • Continue that calculation back through your funnel:
    • How many of your sales qualified leads become opportunities?
    • How many of your marketing qualified leads become sales qualified leads?
    • How many new leads are qualified?
    • How many new marketing generated contacts become leads?

From this data you should be able to determine how many new contacts and leads marketing needs to generate to hit corporate sales goals. (These may vary by product or offering, too. Or deal size.)

You can make a similar calculation for ecommerce sites, and for B2C and retail companies.

Once you have these target funnel numbers you can work on the programs that will generate those new contacts and leads, move them through the pipeline, and help sales close them. Use data and analytics to constantly be improving channels and campaigns.

You may start with a hypothesis: Email generated X new qualified leads last year. We need X plus 25% from email this year. We can achieve that by (1) increasing our list size, (2) changing the frequency of the emails, (3) having more effective offers and calls to action, (4) improving the landing page and conversion experience, or (5) some combination of those and other factors (subject lines, email copy, etc.). Then you can test each of these to reach your results.

Sometimes you will find that a particular channel or campaign simply isn’t going to produce the results that you need. That is valuable information, too; everything is an experiment. Thomas Edison’s team tested 10,000 materials before finding the one that would work for the light bulb filament. He said, “I have not failed. I have just found 10,000 ways that won’t work.”

Persist. Keep experimenting. Keep track of everything. And if you have a valuable product or service, you will find the best channels for generating new business for it.


Marketing attribution

In this omni-channel world where you need to connect with your customers throughout their buying experience, attribution models help you determine the relative importance of the various marketing channels toward the final sale.

There are many marketing attribution models. Let’s look at the pros and cons of three.

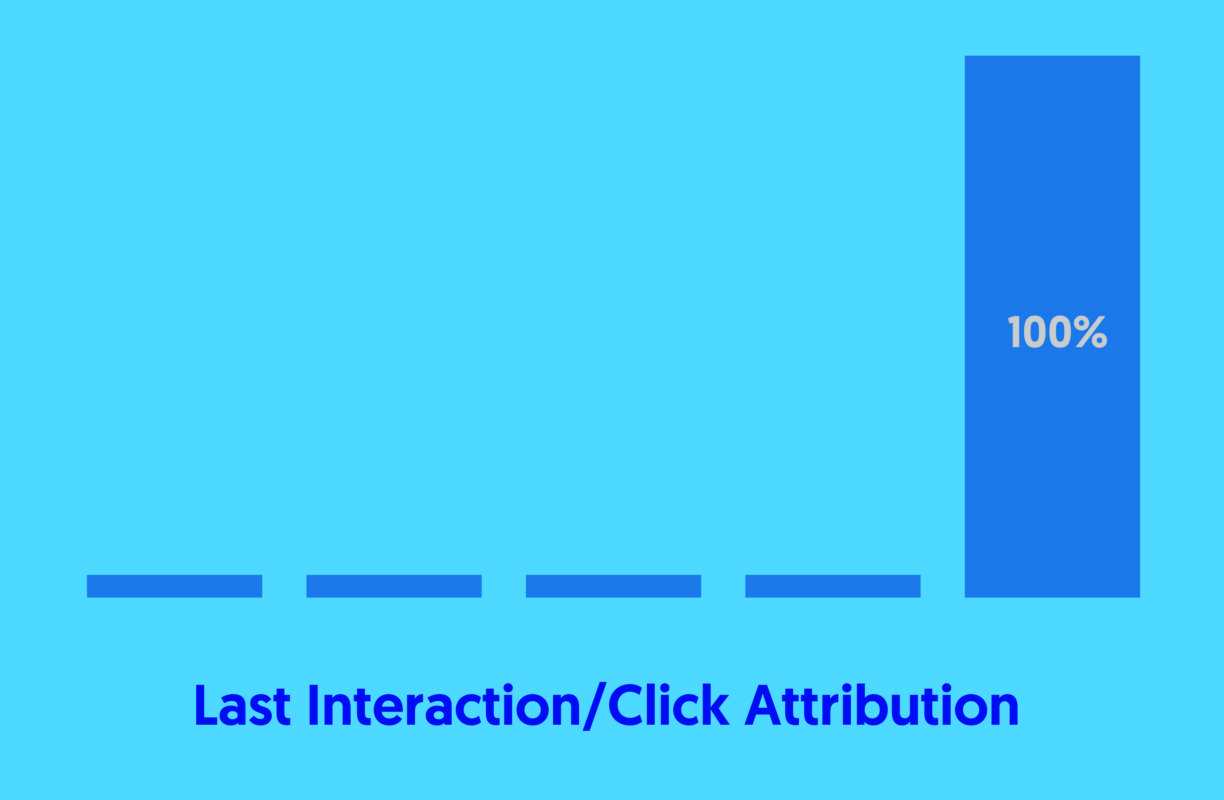
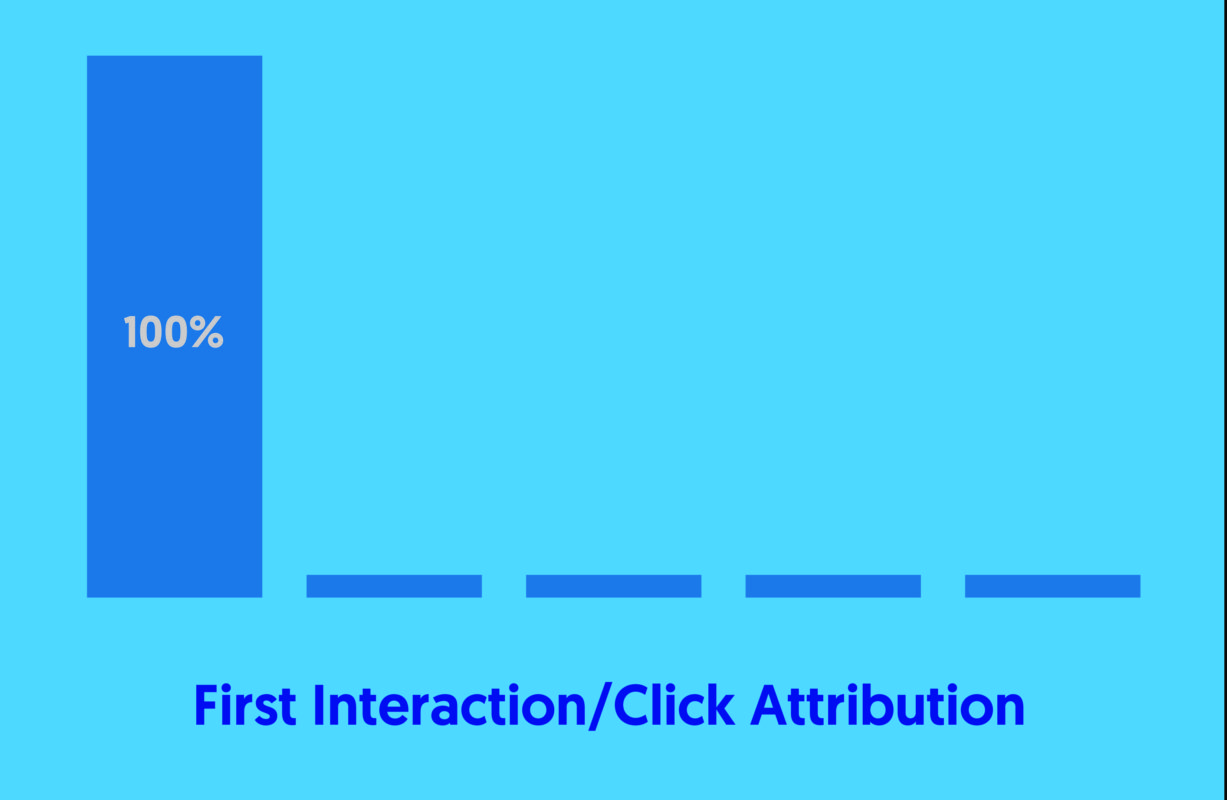
Last click/interaction

Let’s say that a person clicks on one of your search ads, comes to your website, and buys something. With the last click model, you give 100% credit for the sale to the search ads.

However, this is probably not very accurate. The person may have had several interactions with your brand before actually buying. They may have visited the website a few times, read reviews of your products on review sites, watched a few videos on YouTube, and so on. They may have been interested in your product for years. But with the last click model, none of that counts.

Last click attribution chart

Despite these problems, the last click model is the most commonly used for one simple reason: it’s the easiest. Companies may have the data for a last click attribution; it’s much more difficult to track an individual through all of their interactions with your brand on multiple devices that lead up to an ultimate sale.

First click/interaction

The first click model gives credit to marketing for its contribution of qualified leads to the pipeline. This may be an especially useful model in a B2B companies with a long sales cycle and many members on the buying team — in which the sales team will be ultimately responsible for closing the deal.

First click attribution chart

First click may also be the only option for a company that sells through distributors or dealers and doesn’t have insight into which leads are eventually closed and turn into revenue.

Multi-channel attribution

Multi-channel attribution models are the ideal. Time decay is one version of a multi-channel attribution model. It gives a larger weight to the most recent actions but doesn’t entirely disregard earlier actions like the last click model does.

Time decay attribution chart

Multi-channel models present many challenges. The first is the question of identity: how to track individuals across many devices and interactions. You also need a large amount of data to be able to analyze it effectively and tease out actionable insights.

You may want to start with a simpler model and over time move toward a multi-channel model.

Geo-targeted testing

Geo-targeted testing is a different way to measure the effectiveness of particular channels and campaigns. A company operating nationally may test TV or print ads in just two or three cities and measure the increase in brand awareness and sales in those cities to decide if it’s worth it to take the campaign national.

You can use geo-targeted testing with other channels such as emails, retargeting, search and display ads. If your following is large enough, you can even geo-target Facebook posts.

What’s a lead or sale worth?

A key metric for marketers is the customer acquisition cost (CAC).

The CAC is easy to calculate. Simply take all of the sales and marketing costs and divide them by new customers. So on the most basic level if you spent $10,000 on sales and marketing and gained 10 new customers, your CAC would be $1000.

It gets more complex when you start to calculate CAC by channel – remember the issue with the attribution models — and the value of those new customers.

CAC for direct sales, distributors, dealers and online channels may all vary.

And your margins will likely be different by channel, too. For example, a retailer may find that selling online is less expensive than selling in a traditional store. (Or the opposite may be true: in the store, there are little or no picking, packing, and shipping costs. And the building may have been paid for 20 years ago.) Software companies have certainly found that selling SaaS software that’s they deliver online is far less expensive than selling boxes at retail.

Finally, you need to consider if you need to make a profit on every purchase or if you will be basing your strategy on the lifetime value of the customer.

The lifetime value (LTV) is the average profits (not revenues: profits) that you make on a customer during your entire relationship. If a customer typically makes just one or few purchases, like a person buying a house, their LTV may be almost all in that first sale.

I worked with a company that sold high-end computer memory systems. Deals could be worth millions of dollars. They accepted a CAC of tens of thousands of dollars given the profits made on the systems, and the lifetime value of the typical customer over many years. Reportedly the company that won the $2.68 billion contract to operate Boston’s commuter rail system spent over $4 million to win the deal.[i]

Similarly, attorneys bid up the cost per click for search ads for mesothelioma (cancer typically caused by exposure to asbestos) because these cases typically settled for hundreds of thousands of dollars, which the attorney would get 25-33 percent of. It was worth thousands of dollars to get a new client with fees like that at stake.

However, if the economic value of a customer is primarily through a long string of follow-on sales, then you’ll need to calculate the LTV over many years — or even a lifetime. The classic example is companies selling razors, as described in chapter 11.

The same focus on customer lifetime value is why companies like Brawny and Scott pay several dollars per AdWords click to promote their paper towels. They’re getting their product in front of people who are likely to be buying soon. And, if they buy once, the companies may able to convert them into long-term customers. 

Google search results for paper towels

SaaS companies typically calculate that they need a LTV of at least three times CAC to operate profitably. That LTV:CAC ratio will be different for every industry depending on some of the factors that I mentioned above.

Work with the executive team to work this out and establish acceptable CAC metrics for your company.